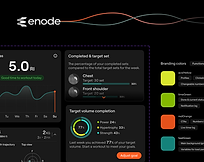
Reducing overload, building AI trust
How a live training tracking screen became something users could actually trust and act on.
Enode One, iOS & watchOS apps

Context
The training tracking screen exists on both ONE and PRO mobile, where athletes and coaches each make real-time decisions during live sessions.

STEP 00
First iteration
Design thinking before user feedback
When I joined Enode, the training tracking screen was creating friction during live sessions. Without formal user feedback yet, I made an initial round of improvements based on design intuition, then built on that later with a deeper UX strategy.
Before: App screenshot
After: First iteration


-
AI Recommendation trust: reframed as system suggestion
-
Load control: target indicator on slider
-
Key metric focus: metric chart inside set cell
-
Progress clarity: IN PROGRESS and COMPLETED badges added
-
...
STEP 01
Problem discovery
Three independent signals
That first iteration solved the surface level friction, but once real usage began, deeper problems started to surface, shown in the three signals below:
KPIs grounded in product vision
The PM set the product vision. I translated it into distinct UX outcomes and responsibilities for each product, Enode ONE and Enode PRO, before defining the KPIs.
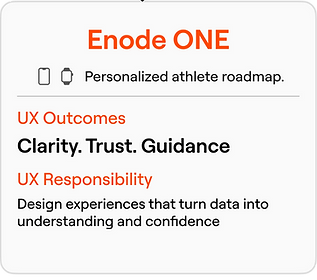
Design KPIs
From those three signals and the product vision, here's what I derived as the design KPIs.
STEP 02
Problem framing
Each design KPI pointed to a category of friction. Here's exactly where and how it showed up on screen.
1 · AI broken trust
1. Source unclear:
Users didn't know why a load was recommended, so they ignored it.
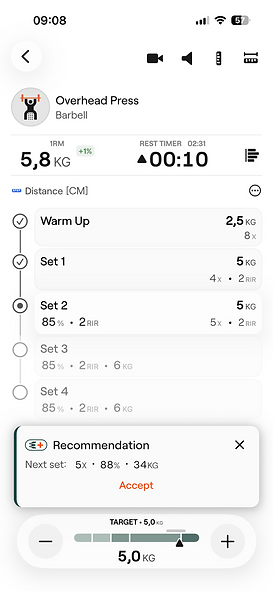
2. Misleading CTA:
Unclear what "Accept" applies to, and the button lacks visual weight.
Original screen
2 · Cognitive overload
2. Visual hierarchy:
KG = action, RIR = effort,
% = system logic, only KG & RIR should be immediately visible
3. Load control friction:
too many taps to reach input; slider useless for large weight changes
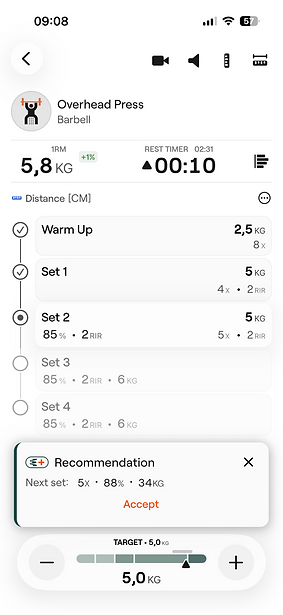
1. Unclear interactions & features:
Video and session insight are poorly placed, the "complete set" cell has no clear tap affordance.

Original screen
From insight to action
With the problems clearly framed, I set a direction before opening Figma. Each of the two design KPIs moved through the same four stages, from what users said to what I did.
STEP 03
Design decisions
With the direction set, here's how each decision translated into the actual redesign.
Calm by default
Resolves: Cognitive overload
1. Decision first hierarchy:
KG is now the dominant metric. RIR provides effort context.
2. Future sets, hidden by default:
Upcoming sets are collapsed and accessible via a chevron.

3. Advanced tools:
Video & session insight buttons moved to a thumb-reachable floating button.
Input without friction
Resolves: Cognitive overload


4. Target visible:
TARGET ~40KG shown above the slider gives athletes a clear reference point.
1. Clear interaction:
A dedicated 'Complete' button replaces ambiguous tap targets.
2. Slider for micro-adjustment:
Kept for fine-tuning, now minimal, to cut cognitive load
3. Keyboard :
The keyboard opens in one tap, removing the extra steps.
AI that earns trust
Resolves: AI Trust
Once I identified the AI trust problem, I collaborated with the sports scientist to build trust before the first recommendation ever appeared, across onboarding, settings, and live training screens.
AI trust UX framework applied

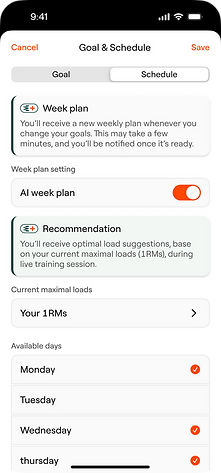

A: Trust journey, onboarding
B: Athlete's profile screen
C: Settings screen
1. Clear CTA:
A primary button in the same color as the AI suggestion card makes the action unmistakable.

2. Source made explicit:
Users now know exactly why this load is recommended.
D: Appears in Live-traning screen
Measuring impact
The redesign shipped to all users without a staged rollout, so no control group or pre-launch baseline exists. Figures below reflect the live product, read against industry norms and observed behavior, not a before/after change.
Cognitive load and trust metrics
Each metric tests one of the two core problems, cognitive overload or AI trust, from a behavioral or perceptual angle, covering both what users did and how they felt. Duration: One month
Retention impact
Higher AI adoption translated directly into lower churn, users who understood the system stayed. Observed across all Enode ONE subscribers in the 3 months post-launch. Multiple factors may have contributed.
Figma prototype
See the flow in motion.

Design journey evolution
Mobile
A visual walkthrough of the redesign, from the original screens to the final flow, shipped across mobile and watchOS.
Before: App screenshot


Result on Dashboard
Result on Dashboard
After: Final design


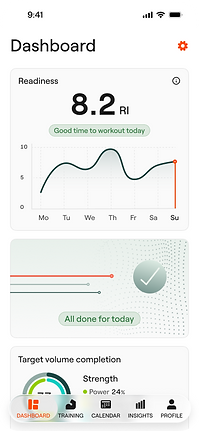
Result on Dashboard
watchOS